MDLI Community Annual Survey – 2021 Payroll Report

Hebrew version
Arabic version
As in previous years, this year we ran the MDLI community’s annual survey, so as to map various trends among those who work in the data science and machine learning fields. This year, an exceptional number of respondents completed our annual survey – 1,250 people – a respectable achievement by all counts. Omri Goldstein, an algorithm developer, data scientist, and creator of the “Data-driven” blog analyzed the survey’s findings. We used his analysis to generate the MDLI community’s 2021 annual payroll report. We also developed a dedicated salary calculator for data professionals in Israel.
In the coming weeks, several additional reports highlighting the survey’s results will be uploaded to the website. They will cover topics such as the following: how we built our new salary calculator, the status of gender pay gaps in the market, and the analysis of various roles and their associated responsibilities. The full payroll report is the first publication on the matter to be released, and it can be viewed, in its entirety, below.
In this report, we will segment the salary data according to position, education, seniority, age, experience, gender, and other metrics. When analyzing the influence of various responses on the salary, we are, of course, exposed to the influence of intervening variables. For example, the average salary mentioned in the survey was 38,500 NIS per month for those working in Tel Aviv, as opposed to 26,600 NIS per month for those working in Jerusalem. These findings are likely to be useful to people considering a move from the capital to Tel Aviv (or vice versa. That being said, one cannot expect a roughly 12,000 NIS salary jump based on relocation alone. Perhaps the available positions are different in Tel Aviv (variety and quantity)? Or, maybe the average education level is the cause? There is no end to lines that can be drawn and the environmental links that can be identified. In this report, we will rely on intersections between 2-3 variables at a time and will present the average salary, as well as other statistical metrics for each category. This, so as to learn as much as possible about the distribution as a whole.
Note: No singular data points will be presented, so as to fastidiously protect the privacy of each and every respondent (and our ability to learn from the conclusions). Data presented will always be an aggregation of at least 10 samples.
The Salary Calculator
Before we get started, we’d like to circle back to the MDLI community’s new salary calculator, which we will be launching for the first time this year, based on insights from the survey. Attempts to find salary information on high-tech professions generally lead to various recruitment company’s salary charts. These charts are useful, but are in no way transparent; how are the salaries calculated? What is the sample size and how long was the sample studied? What is the significance of the range? The questions go on. Our findings enabled us to build an alternative salary chart in the accepted format, and our salary calculator will allow you to view the range within which 50% of the sample respondents earn (or where the model predicts 50% of the respondents will be); not just the average forecast. You can try our calculator out here.
The following chart is to be used for comparison purposes, so that you can get a general feeling of the situation. The chart is based on survey findings and is formatted like a classic salary chart that presents the average salary and is divided according to years of experience in a given position:
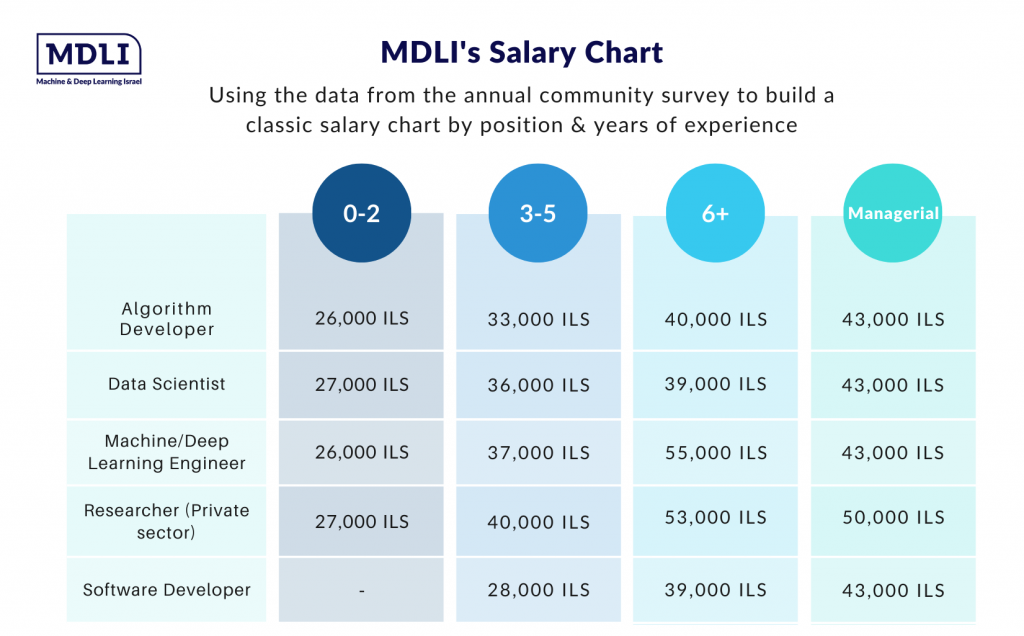
Note: for some of the roles, the average salary for a managerial position is lower than the salary for the salary for employees with higher levels of experience. In both cases, there are many managerial level respondents, ensuring that the numbers truly represent our sample population. That being said, it is clear that the meaning is not that a promotion to management will necessarily lead to a decrease in salary. Rather, it seems as though, in certain instances, more experienced workers and managers come from different distributions, where the managers aren’t necessarily experienced researchers who transitioned into managerial positions.
Overview
After filtering out part-time employee respondents, as well as those who did not complete their salary requirements, or were screened for various other reasons (for example, for working abroad or serving in the IDF), 997 respondents remained. The survey’s salary brackets jumped by 5,000 NIS at a time (for example, from 20,000 NIS to 25,000 NIS). A middle-range salary was selected for each sample. The average salary among the sample population was 36,500 NIS per month. As quite a few respondents indicated the survey’s maximum salary bracket – 70,000 NIS and up – one can assume that the real average is even higher than this number. The average salary for male respondents was 37,300 NIS, while the average salary for female respondents was roughly 3,000 NIS lower: 34,300 NIS per month. This 8% gender pay gap was similar to the gender pay gap identified in previous surveys. In this report, we will refer to the gender pay gap in relation to various intersections, with most of the analysis on the pay gaps to be made public later.

For comparison’s sake, in a survey formulated two years ago, the average monthly salary was 31,000 NIS. Three years ago, a similar survey found the average salary to be 29,000 NIS. This year’s average salary is higher than in previous years, thanks to the fact that, this year, the average salary trended downwards – far more significantly than in the past – due to an abundance of respondents earning above the survey’s maximum salary bracket. While the distribution (of respondents) is likely to change from year to year, the salary jump evidenced from this year’s findings remains astronomical.
Position
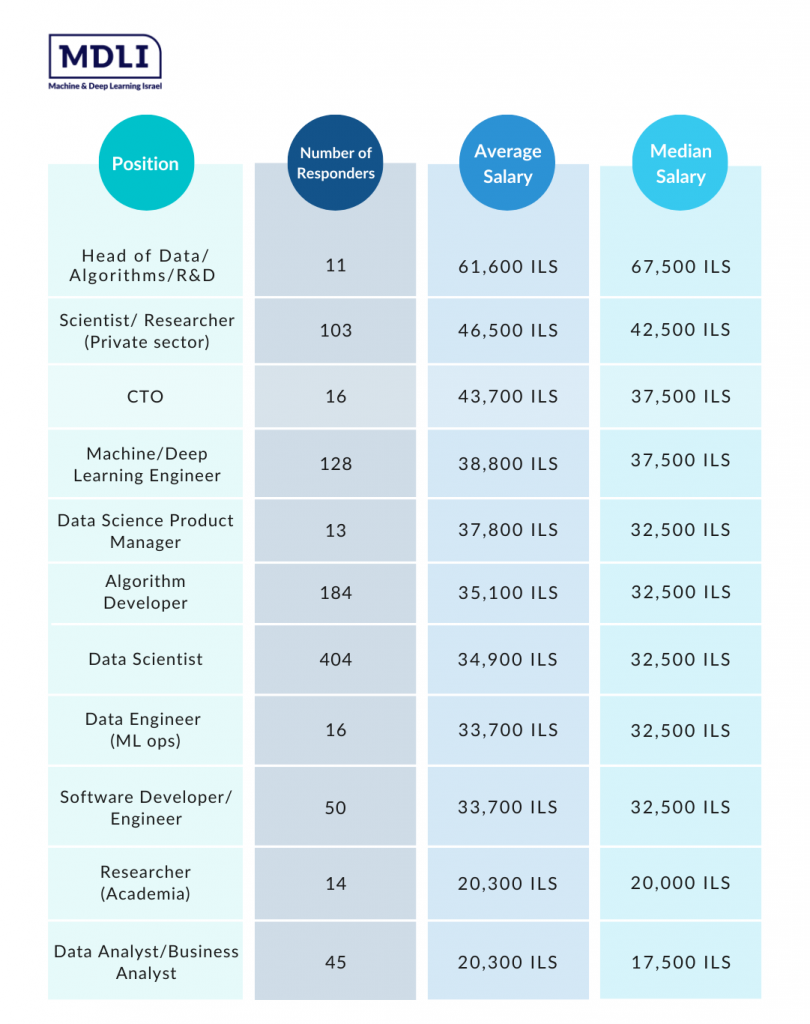
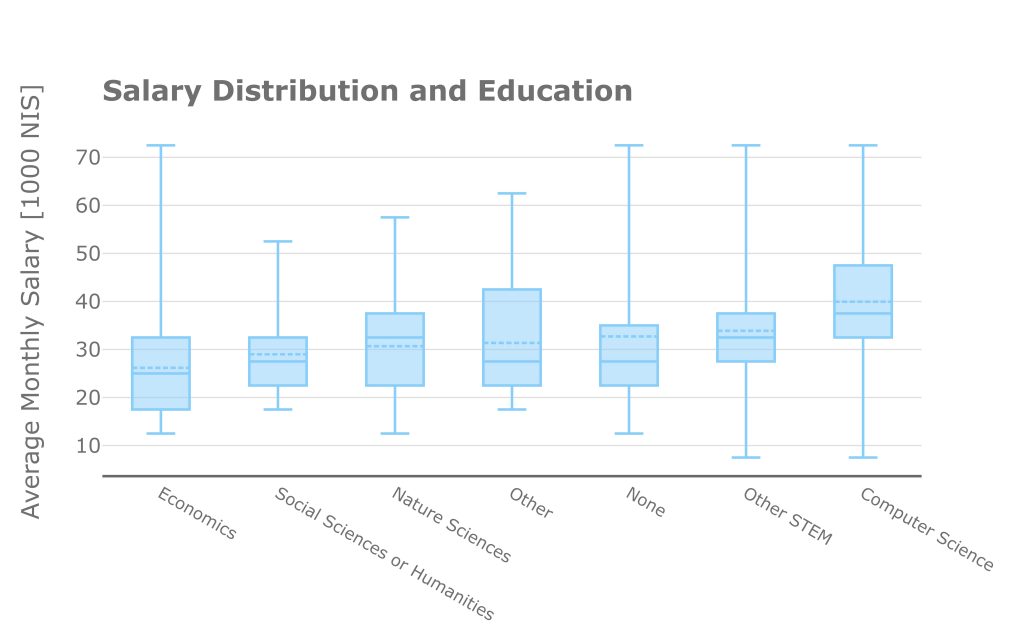
The most common position in this survey was that of the Data Scientist: over 404 of the respondents work full time in this position. Other popular positions include Algorithm Developer (184 respondents), Machine Learning Engineer (128 respondents), and Researcher (103 respondents). Those respondents earning the highest salaries were researchers, with an average monthly salary of now less than 46,500 NIS. The researcher’s salary came second to those respondents in managerial or executive positions, such as VP R&D or Head of AI, for whom the average monthly salary was 61,600 NIS (Note that this group contains far fewer respondents who were artificially grouped together. I decided not to present them in the graph). Next were positions such as CTO with an average monthly salary of 43,700 NIS, Machine/Deep Learning Engineer (38,800 NIS), Data Science Product Manager (37,800 NIS), Algorithm Developer and Data Scientist (35,000 NIS), Data Engineer (33,700 NIS), Software Developer (33,700 NIS), and Data Analyst (20,300 NIS). The boxplot below provides insight into the salary distribution of various positions. The dotted line represents the average, while the box encapsulates 50% of the dots (namely, the salaries following within the 25th to 75th percentiles). The continuous line within the box represents the median:

Among private sector “Scientists and Researchers,” there is an over-representation of PhDs (as was expected): 30%, as opposed to 14% from the general sample (and 60% of private sector respondents holding master’s degrees, as opposed to 55% of respondents hailing from the general sample). Among those defined as Researchers, those with PhDs earned an average monthly salary of 57,000 NIS, while those with bachelor’s or master’s degrees earned 43,000 NIS per month. I tend to believe that years of experience in the industry contribute more to one’s career than advanced degrees, but these findings point in another direction.
Education
Over half of the respondents studied computer science, software engineering, or electrical engineering. A bit over a quarter of the respondents (290) studied other exact sciences such as physics, mathematics, statistics, and other engineering disciplines. The remaining respondents either studied nature sciences (chemistry, biology, neuroscience, etc.), social sciences, or economics (which I separated from the other social sciences). A small minority either did not study at any university at all, or came from other fields, such as philosophy. The salary for computer science and electrical engineering graduates was highest: 39,200 NIS per month. Exact science graduates took second place with an average monthly salary of 33,500 NIS, followed by those who completed nature science (30,600 NIS), social science (29,100 NIS), and economics degrees (26,100 NIS).

These findings can, of course, be misleading. For example, 38% of nature science graduates hold doctoral degrees (PhDs), while only 6% of respondents who graduated with a degree in economics have doctorates. As such, one cannot infer that a degree in economics will certainly lead to a lower salary than a degree in social or nature sciences, especially when considering two identical candidates. Our salary calculator will attempt to provide satisfactory responses for these questions, while seeking to control any intervening variables, as much as possible.
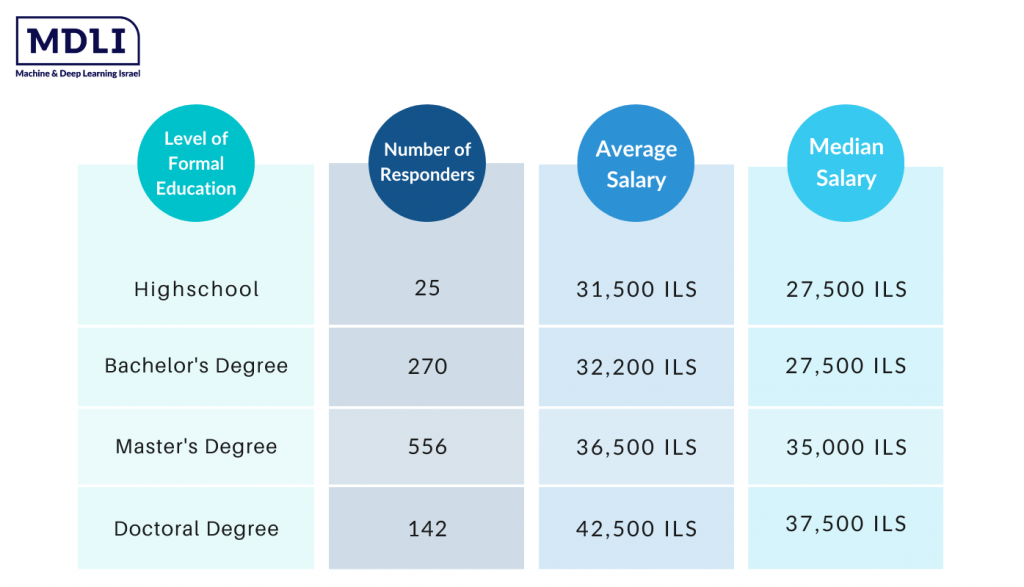
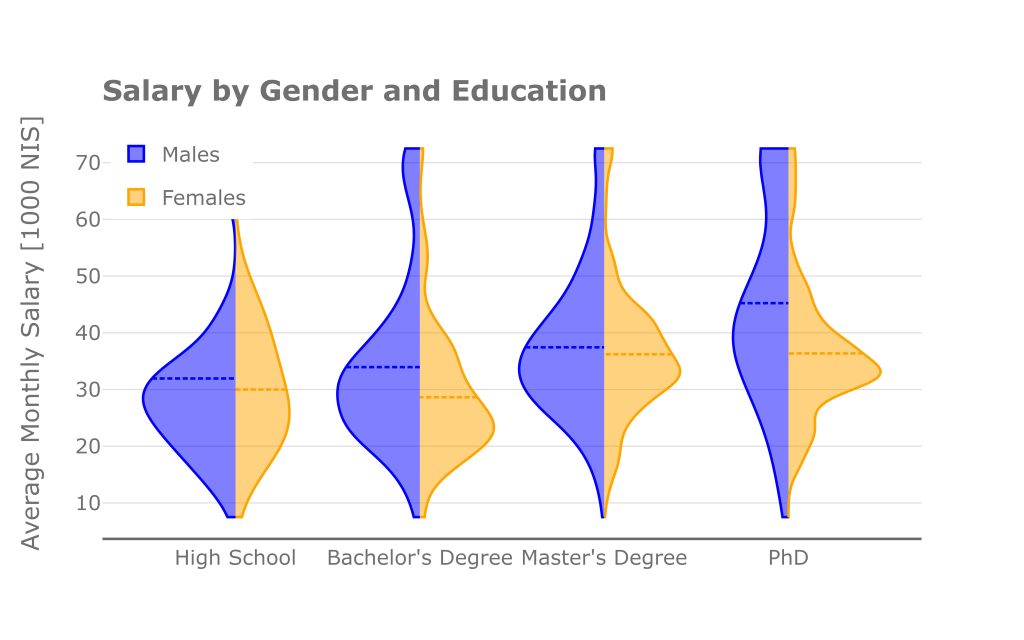
This year, the most common level of education was the master’s degree, as it was held by roughly 55% of the survey’s respondents. Approximately 27% of the respondents held bachelor’s degrees, and about 24% held PhDs. The respondents’ salaries strongly and clearly correlated with their level of education; those holding PhDs earned an average of roughly 42,500 NIS per month, followed by those holding master’s degrees (36,500 NIS), and bachelor’s degrees (32,200 NIS).
Next, we referred to the gender segments. One can see that there is a gender pay gap across all education levels. Among master’s degree graduates, the gap is worth about 1,200 NIS (37,400 NIS vs. 36,200 NIS), or 3%. However, among bachelor’s degree graduates, the gap is worth roughly 3,000 NIS, or 11%, a gap that stretches to no less than 9,000 NIS or 24% (!) for doctoral degree graduates.
This tremendous gap can, in part, be explained by fields studied by the respondents during their doctoral studies. 57% of male PhDs studied computer science or similar degrees, while 28% studied other exact sciences. As we have seen, these are the degrees that lead to the highest-paying professions. Among female respondents, the findings were 24% and 25%, respectively, while 30% of PhDs studied nature science disciplines other than physics. That being said, this is not the only explanation for the gap; one can see that the gender pay gap exists across all education levels, and this gap tends to be even greater among more senior and more experienced professionals (to be detailed shortly). In this way, for example, male graduates of computer science or similar PhD programs earned an average monthly salary of 49,500 NIS, over 6,000 NIS more than women with identical degrees. That’s a 13% gap, even when controlling for the respondents’ level and field of education.
Statistical analysis indicates a significant result of P=0.06. Namely, assuming that results are significant if P<0.05, this gap could be the result of statistical noise (stemming from there being only 15 women in the studied category). In essence, one cannot refute the null hypothesis, according to which there is no gap in the average salaries of male and female computer science PhDs. As the difference is more or less in the expected direction, it provides very little comfort and, in my opinion, would repeat itself, were we to formulate another survey. Moreover, the gaps were large and consistent for computer science master’s degree holders as well.
Salary According to Seniority, Management Level, & Experience

This year, we asked our survey respondents about their seniority and management levels, for the first time. These metrics have proven to be strong features for our salary calculator. The average salary for “junior” positions was approximately 26,000 NIS per month, while “middle” positions earned an average of 33,300 NIS per month, and “senior” positions earned an average monthly salary of 44,900. The gender pay gaps among the two more junior seniority levels (“junior” and “middle”) were on the verge of statistical noise, but the same cannot be said for the most senior positions. Males classified as holding a “senior” position earned an average of 45,500 NIS per month, 3,000 NIS more than females with the same seniority level. The distribution and its average are, therefore, extremely influenced by a high concentration of males earning in the highest salary brackets (over 70,000 NIS per month).
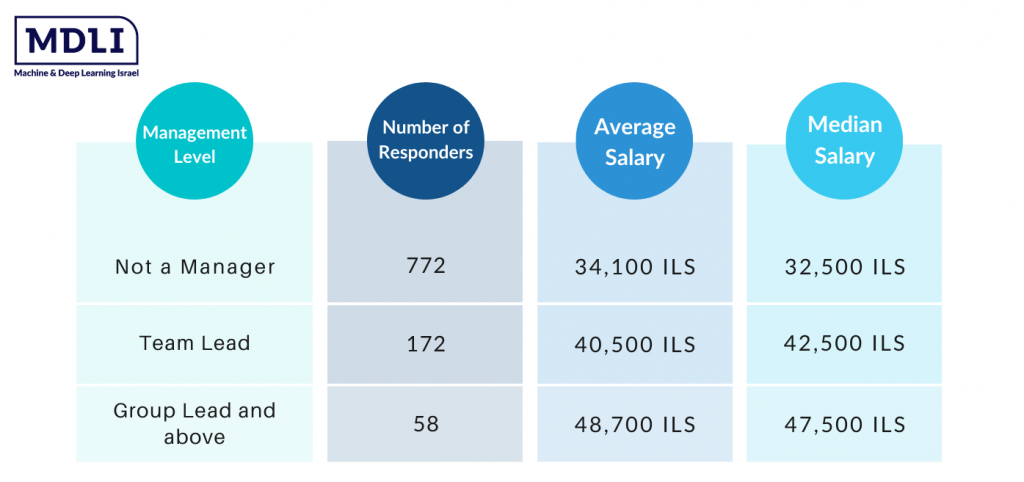
A similar image is obtained when analyzing the salary distribution according to management levels. Employees who were not team leaders earned an average of 34,100 NIS (approximately 77% of respondents belonged to this category). Roughly 17% were team leaders and earned an average of 40,500 per month. Anyone who was classified as holding a position “more senior than a team leader” earned an average monthly salary of 48,700 NIS. Note that the latter was broadly defined, meaning that any senior position could be included; from Department Head to CEO. As such, the salary distribution took a flatter and more uniform shape than those of the two other categories.

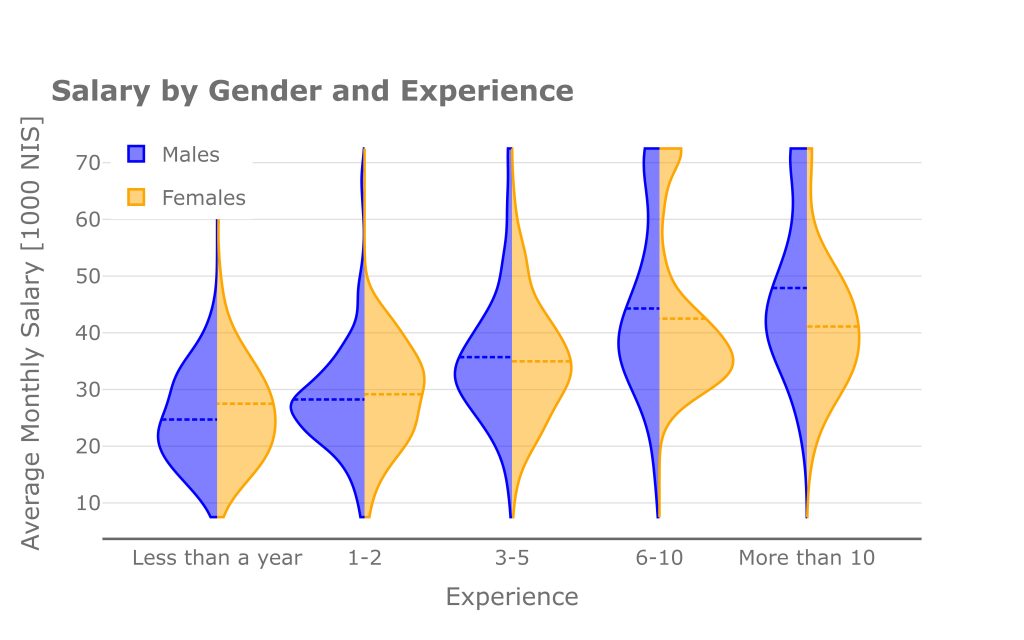
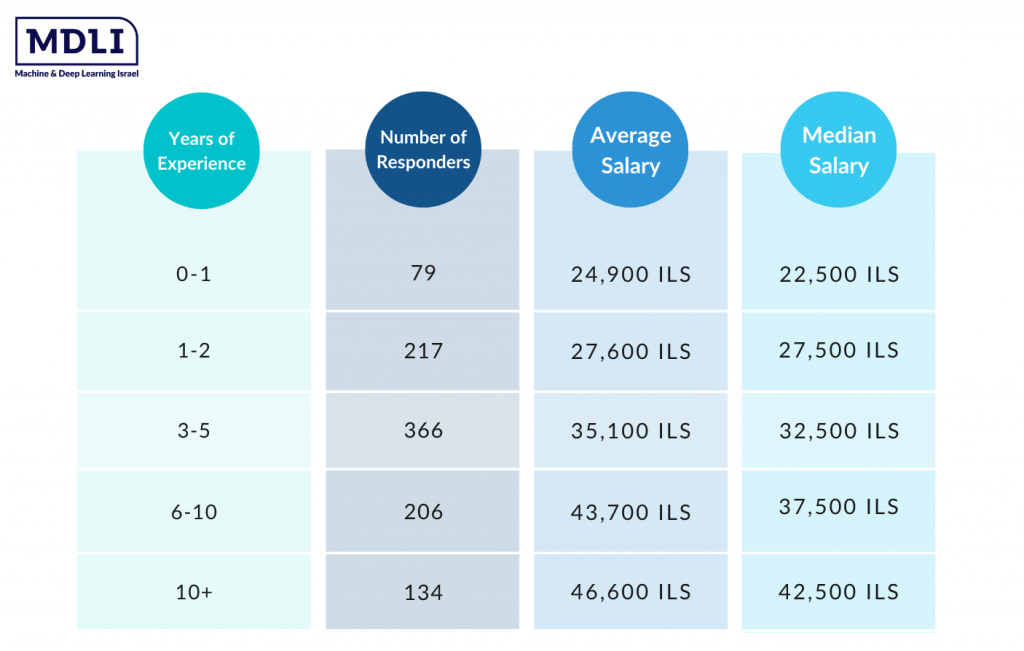
The next component to a respondent’s seniority level is how many years of experience they possess. As expected, salaries increase with experience. The average salary for an employee with minimal experience (0-1 years) is approximately 25,000 NIS per month, after which it increases to 27,600 NIS (1-2) years), 35,100 NIS (3-5 years), 43,700 NIS (6-10) years, and up to an average of 46,600 NIS per month for those with over 10 years of experience. Here too, the gender pay gap grows with the level of experience; for respondents with less than 5 years of experience, the gap is not significant at all, but for respondents with over 10 years of experience, males earned an average monthly salary of 47,800 NIS, which was 16% more than the average monthly salary of 41,100 NIS earned by females.
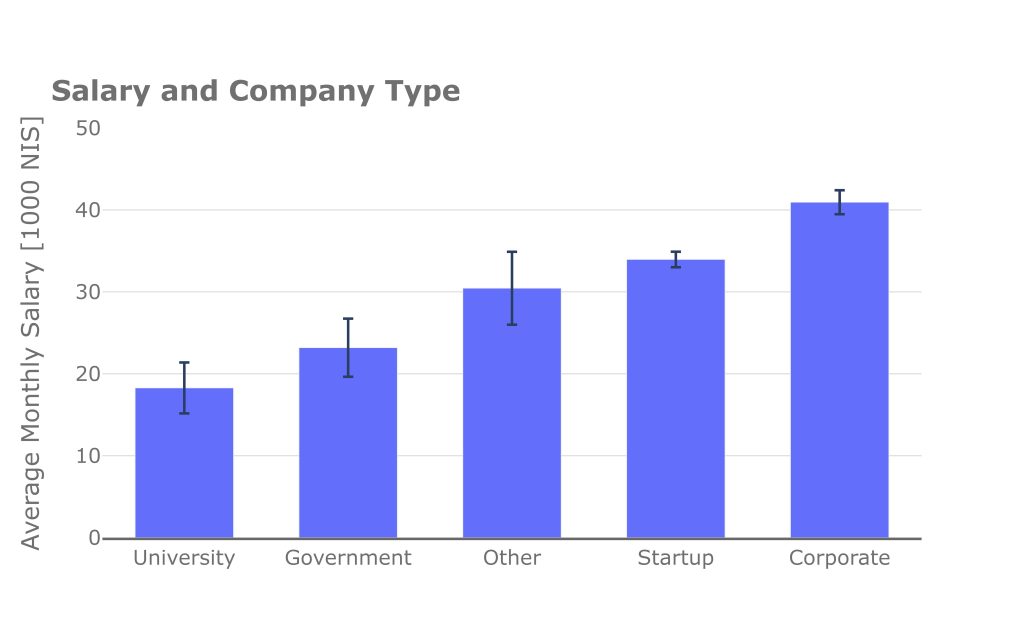
Type of Company
The vast majority of respondents (over 90%) worked for companies classified as “startups” or “corporations.” The remainder worked either for the government, a university, or other entities (not including the IDF) that provide services, are subsidiaries, or are small, yet do not fall under the startup or corporation categories. The highest earners were those respondents who worked for corporations (approximately 40,900 NIS per month), followed by those employed by startups (33,900 NIS), “others” (30,400 NIS), the government (23,100 NIS), and universities (18,200 NIS).

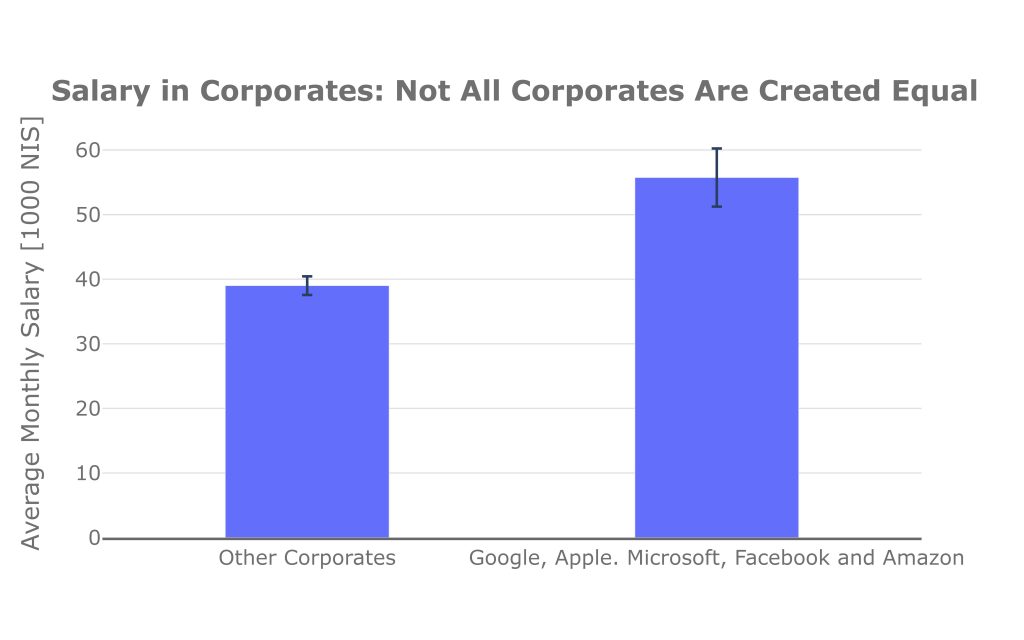
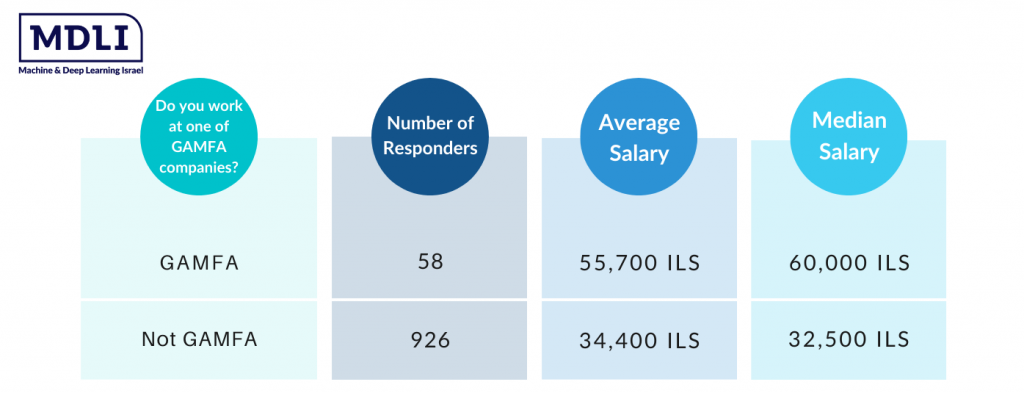
This year, we added a general question to the survey. This question pertaining to respondents’ belonging to one of the field’s five largest companies: Google, Amazon, Facebook, Apple, and Microsoft (GAFAM). The most remarkable finding from the survey is the tremendous pay gap between those working in these companies, and those working in others. The division of the “corporation” category into respondents employed at one of the GAFAM companies and those employed elsewhere teaches us that the average salary among GAMFA employees is no less than 55,700 NIS. Namely, the average salaries in the sample trended downwards, due to the limiting of the salary value to 70,000 NIS. In most cases, this influence is negligible, but in this case, the value was also the most common salary bracket for those belonging to this category. The median salary for this group was 60,000 per month, which alludes to a deviation that is lower than the average. Among other corporations not belonging to the five largest companies, the average monthly salary stood at 39,000 NIS. It is possible that some large corporations within this category do, indeed, pay extremely high salaries, but that they were “swallowed” by the other corporations, leading to a far lower average.
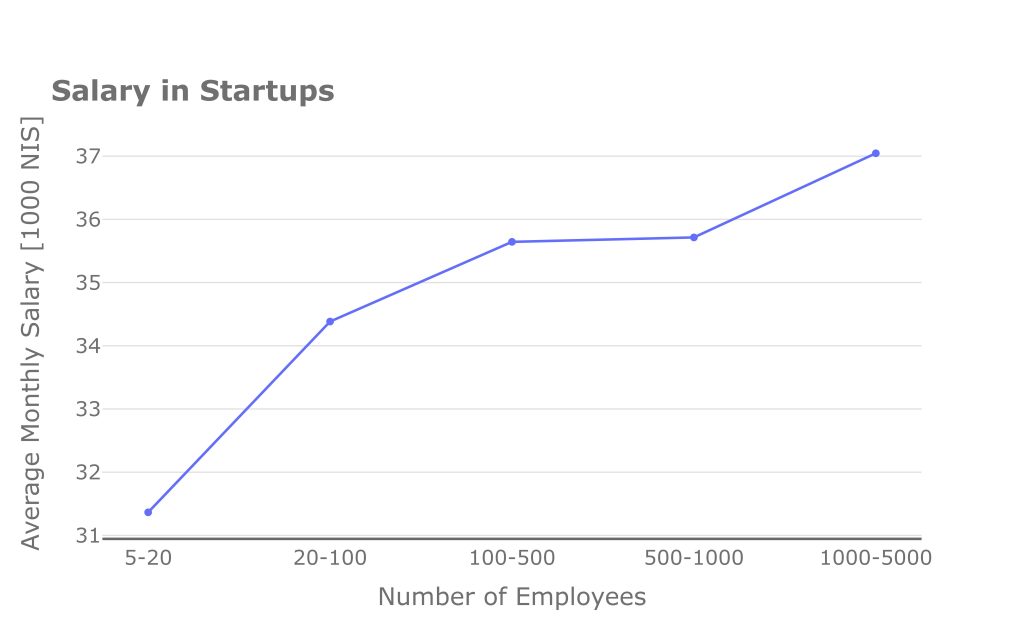
While popular perception has many envisioning startups as a group of students working on one innovative product or another in their garage or dorm room, a glance at many Israeli startups tells a very different story. In reality, some startups employ hundreds or even thousands of workers. As such, including all types of startups within a single category can be deceiving. When salary is depicted as a function of the number of employees in a startup, one can clearly see how the average salary increases from 31,300 NIS per month among very small companies, to 37,000 NIS per month for large companies with over 1,000 employees. Furthermore, for startups in general, and small startups in particular, gross salary options can be very hard to capitalize on, creating an unfair advantage for larger companies.
Age
The average age of the survey’s respondents was 34, with no significant difference between genders or between the average and median ages. As expected, the average salary increased with age:
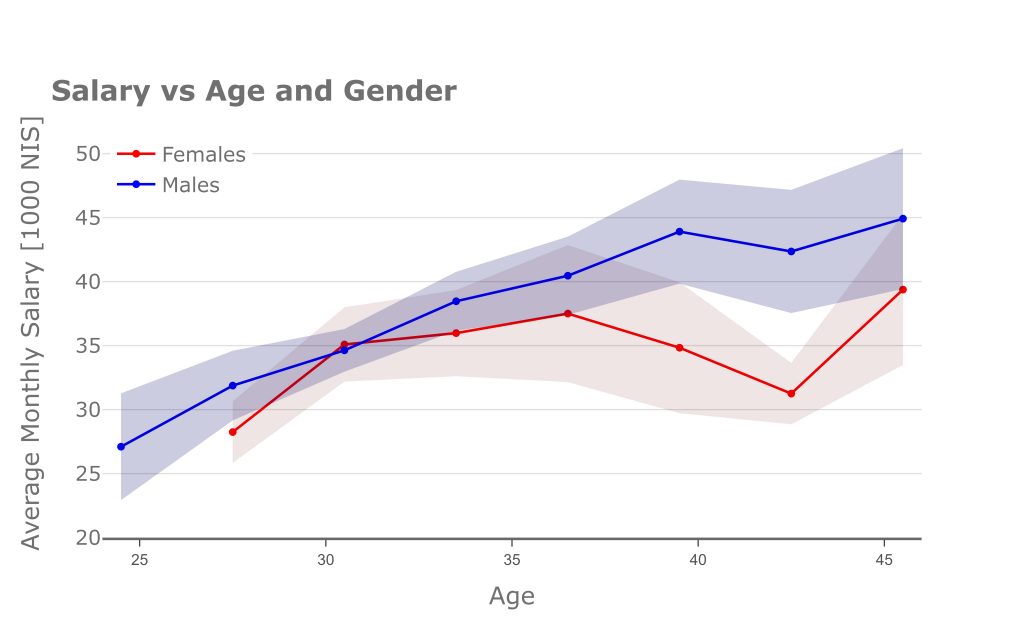 The average salary among males increases in a linear fashion by a little more than 1,000 NIS per year from age 25 to age 40, when it more or less stabilizes (as described by the survey’s respondents. This is not necessarily a description of an employee’s career). For females, the picture is even more striking, due to fewer females responding to the survey (23% of the entire sample). However, it is clear that their salary reaches its peak at a younger age (36) and at a lower summit. Thus, if the average salary for males and females was nearly identical at age 30, the gender pay gap is far greater and more significant by the time age 36 was reached.
Geography
Those working in Tel Aviv (or those employed by Tel Aviv-based companies, even if working from home) earned the highest salaries; a monthly average of 38,500 NIS. Tel Aviv was followed by the Haifa region (35,300 NIS), central Israel (including the Sharon – 35,100 NIS), southern Israel (31,800 NIS), northern Israel (28,100 NIS), and finally, Jerusalem (26,700 NIS). I added the 12 respondents who worked abroad for comparison’s sake. As expected, they were the group with the highest average monthly salary: 42,000 NIS. What could explain the low salaries earned in Jerusalem? The mix of positions certainly plays a partial role. The survey did not include even a single researcher (private sector) from Jerusalem, despite the fact that the category was quite large and reflected the largest average earners. On the other hand, Jerusalem was overly-represented by analysts (12%, as opposed to 4% of the overall sample) and academic researchers (6%, as opposed to 1% of the overall sample), positions that earn the lowest average monthly salaries. In addition, development centers owned by corporations that pay the highest salaries were mostly found in Tel Aviv, Herzliya, and Haifa; not in Jerusalem.

Summary
The survey’s findings allowed us to receive an updated image of the salary situation in artificial intelligence and science fields in Israel. It seems that growth in the field stems from an increase in the average salary, as compared to that of previous years. Nevertheless, we there are still various pay gaps between males and females that can, sometimes, increase in severity throughout their careers. In the near future, we will be publishing a report that is dedicated, in its entirety, to an analysis of these gaps. This, in the hopes of shedding even more light on this issue and understanding its sources.
To cope with these gaps and provide the broadest possible portrait for all those delving in the field, we launched a salary calculator. New this year, our salary calculator will be a significant tool for job seekers, enabling anyone to obtain precise information based on their personal status. This will better prepare them for any job or salary negotiations. We additionally view this calculator as a social tool that can be used to correct existing discrepancies within today’s market.
On a personal note, I would like to thank Omri Goldstein for his exceptional analysis; Inbar Dolinko, who championed the entire operation and ensured it went off without a hitch; and our community members, who responded to the survey and assumed active roles in the process. Thanks to you, we succeeded in putting together a comprehensive and detailed report this year; its findings will surely advance the Israeli data field as a whole, and will contribute to all those who delve in this content world.