Who is the data scientist? A data-based answer

Each year, the MDLI (Machine Learning & Deep Learning Israel) community asks its members to complete a survey that helps us better understand the AI and ML industry in Israel. The results of the survey were used to create a few reports – a salary analysis and a behind-the-scenes look at how our salary calculator works. This third installment will address one of the burning questions in the field: Who is a data scientist, and what does he/she do?
This is a translation of the original post in Hebrew. The original version was written by Omri Goldstein.
It’s very common to see Venn Diagrams describing the data scientist as both a programmer, a statistician, and maybe even a detective or a philosopher. I don’t find those descriptions very helpful to understand the typical workday of a data scientist. That’s why I’ll try to answer the question from a more quantitative perspective, using the results of our community survey.
This report is going to be filled with detailed visualizations so I’ll start with a tl;dr – a table that summarizes the common data-oriented positions in the industry (with some of my own interpretations):

What are the everyday responsibilities?
This year we added a new question to the survey: What are the everyday responsibilities in your position?
If we segment the answers by position, we can get some interesting insights. I’ll focus on a few specific comparisons.
First, let’s look at two positions that are commonly confused with one another: data scientist and data analyst.
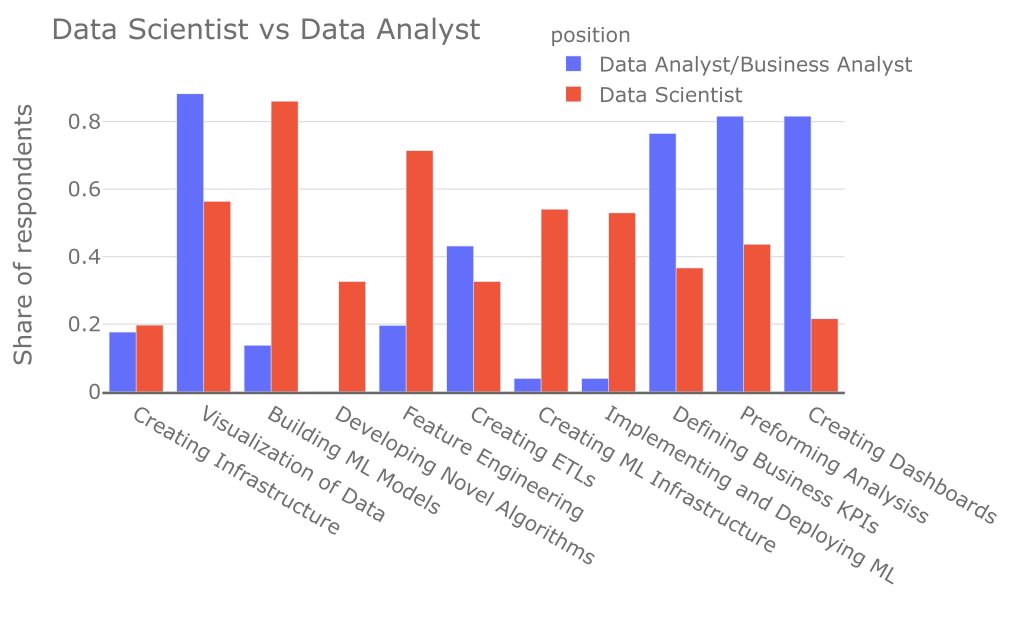
We can see that the most common responsibilities for data analysts are creating visualizations of the data (88%), creating dashboards (84%), and defining business KPIs (76%). For data scientists however, the main responsibilities are training models (86%), feature engineering (71%), creating visualizations (56%) and everything revolving around the implementation and deployment of ML models and infrastructure (a little over 50% for both). The main component of a data scientist’s job is definitely training models. But there is some overlap and a possible “transition route” between the positions, as many data scientists work on creating dashboards and analyses.
It’s interesting that about half of the data scientists deal with what is somewhat considered the dirtier aspect of the job – writing code for production or building the infrastructure for data collection. It seems that there are two competing approaches when it comes to the responsibilities of the data scientist – whether the role begins with a CSV file and a DB and ends with a trained model, and whether it continues further to the infrastructure. There isn’t a single conclusion in our data, and I’m sure the question will raise an interesting discussion for many.
According to our survey, there isn’t a lot of difference between a data scientist who works in a startup and one who works in a corporation. The big difference is that 60% of startup data scientists build infrastructure, where only 45% of corporation data scientists do that. This finding makes sense – in a small startup, data scientists typically handle a broader role that bears more technical responsibilities. Yet, overall, it is a very small difference.
Another interesting comparison is between data scientists, algorithm developers and researchers in the private sector. Here, again the line between the roles isn’t always clear. For example, many job posts online mention similar requirements for those three different positions (perhaps with the exception of education, as sometimes researchers need to have a Ph.D. to apply). This graph presents the differences when it comes to the responsibilities of each position:
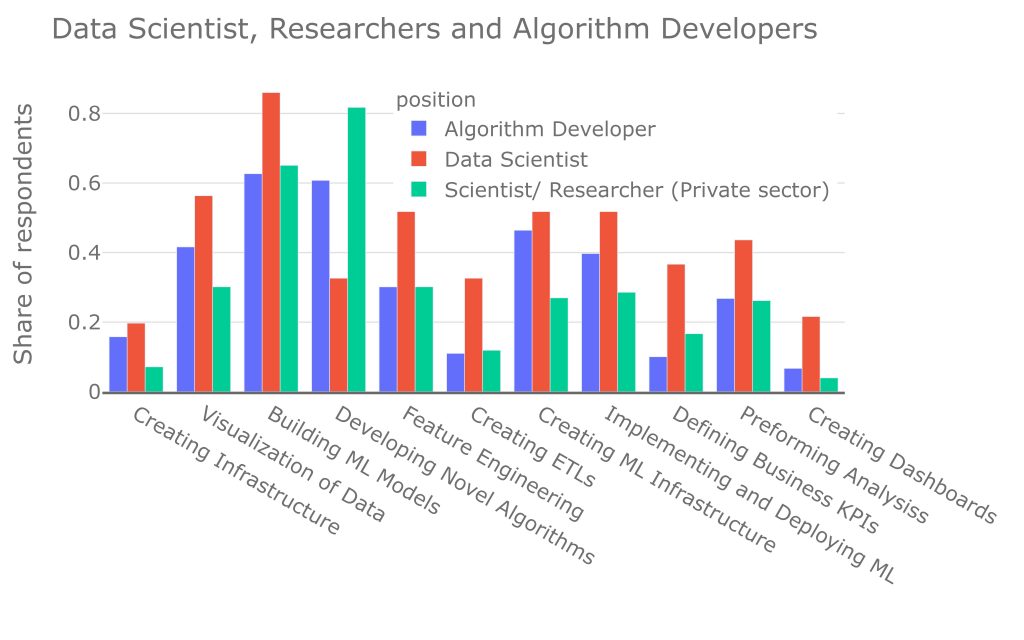
There is a significant similarity. The most notable difference is developing novel algorithms that can't be taken off the shelf or from open-source libraries – 81% of researchers and 61% of algorithm developers mentioned this as a significant part of their day, where only 32% of data scientists said the same.
On the other hand, most of the responsibilities of a data scientist include creating dashboards, analyzing the data, and visualizing it. The data scientist role can be seen as a middle ground between data analysts, researchers, and algorithm developers.
Researchers and algorithm developers differ most in their responsibilities regarding infrastructure, though that difference is not significant. Only 26% of researchers create ML infrastructure, compared to 46% of algorithm developers. 39% of algorithm developers deploy their models in production compared to 28% of researchers. 15% of algorithm developers create general infrastructure, whereas only 7% of researchers do this.
About 60% of researchers and algorithm developers train models. Similar to the data scientist position, this is one of the main components of these roles.
It’s interesting to compare researchers in the private sector and in the academy:
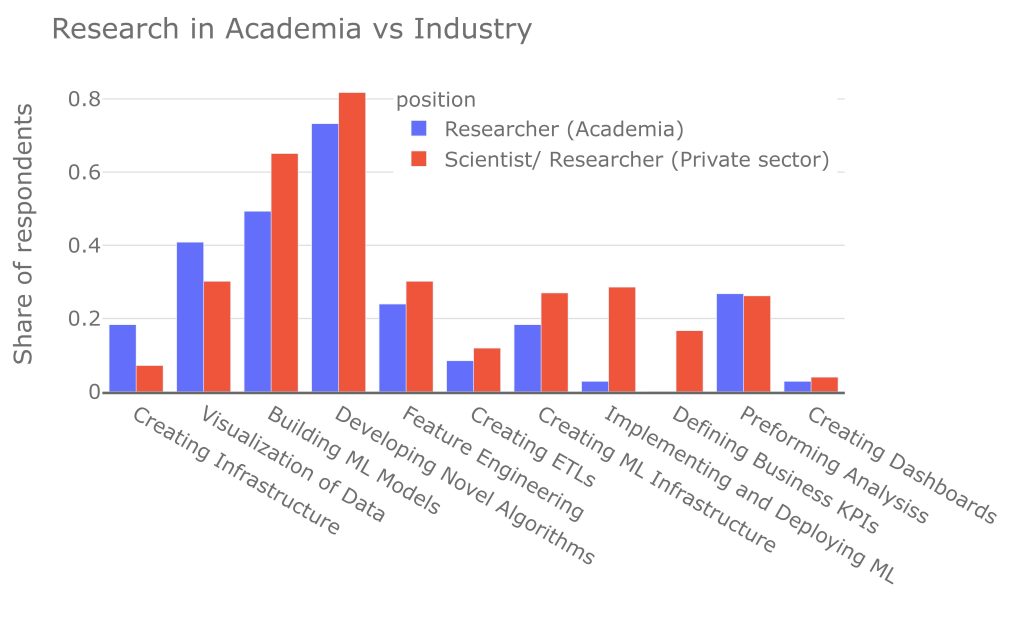
There are similarities between the groups; building models and developing novel algorithms are the lion's share of the role of researchers from both the academy and the private sector. The main difference between private researchers and academics is that private-sector researchers spend more time on business questions and algorithm development – which is not surprising.
Another common position in our survey is the Machine/Deep Learning Engineer. It isn't clear whether this role is more like that of a data engineer or an ML algorithm developer. The answer appears to be the latter:
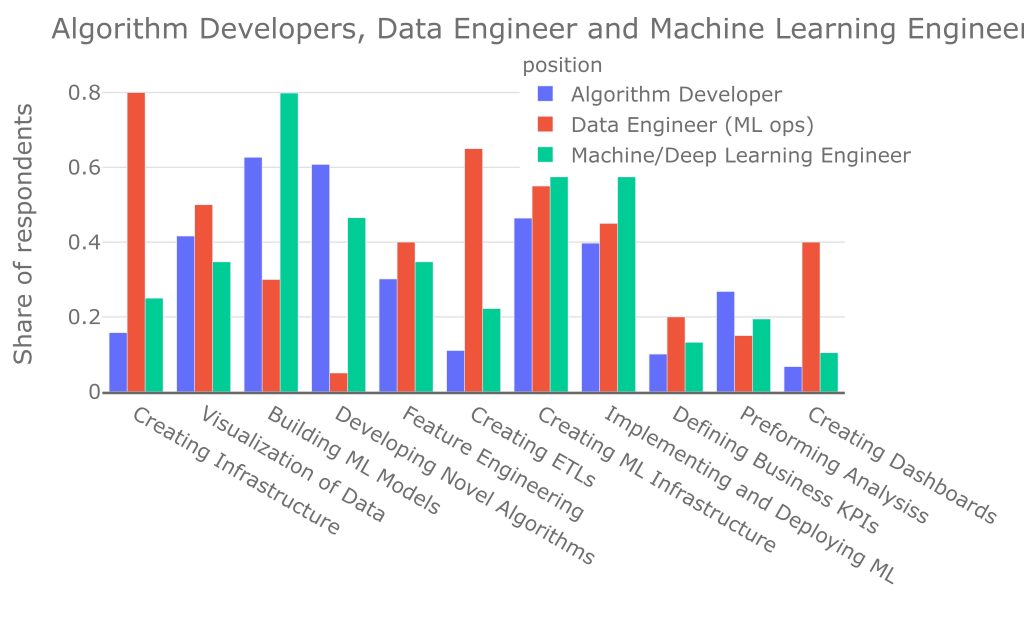
As the data scientist, the ML engineer’s main role is to train models. An ML engineer's role focuses more on creating infrastructure than creating data visuals and analyzing data and engineering features. However, 46% of ML engineers also mentioned that their role included developing novel algorithms. By looking at each role's responsibilities, it appears that the ML engineer is the more technical version of the data scientist or the algorithm developer.
Below is an interactive visualization; you can play with it to view more interesting insights by clicking and double-clicking on the position on the right (click on the picture to open the interactive graph on a different tab):

When it comes to programming languages, the results are pretty insignificant. As can be expected, for all positions, 80%-100% of respondents mentioned Python as one of the languages they use. No other language was as popular. 35% of algorithm developers and 25% of software developers also mentioned C++. In addition, 25% of academics and 20% of algorithm developers mentioned MATLAB, 20% of data engineers mentioned Scala, 30% of data engineers and 22% of software developers mentioned Java and 24% of software developers mentioned Java Script. No other language has been mentioned by over 20% of respondents.
What about education?
So far, we have looked into specific comparisons, between 2-3 positions. In the following section, I’d like to create a holistic perspective on all data positions combined. To do so, I’d add into my analysis the education of the respondents (both field and level).
First, I’ll represent all respondents by their education and job responsibilities only. By using PCA to and selecting the top two principal components we’ll get the following 2D visualization:

I interpret the graph this way: The horizontal axis separates data scientists and analysts from the rest of the positions. The vertical axis, however, separates positions that use ML algorithms (and algorithmics in general) from those that don't. In other words, the top left quarter includes developers and software engineers, while the top-right quarter includes analysts. In the bottom right quarter, you'll mostly find data scientists, and in the bottom left quarter, you'll find algorithm developers, ML engineers, and researchers.
Similarly, if each point represents “category” instead of a respondent, we can present different categories in a similar display using MCA (click on the picture to open the interactive graph on a different tab):
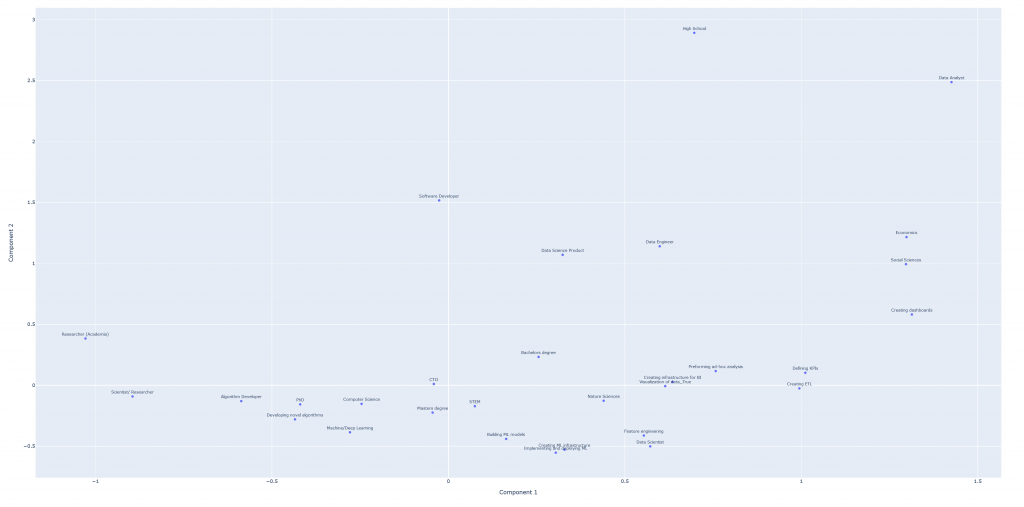
Here we can see that there is very little distance between PhDs, researchers, and developing novel algorithms. On the other hand, economics and social science graduates are closer to the position of data analyst or to the role of creating dashboards. The map is interactive to allow you to get closer and look for more information.
Positions and Education field
The following chart is the result of examining the educational background and positions of our respondents (click on the picture to open the interactive graph on a different tab):
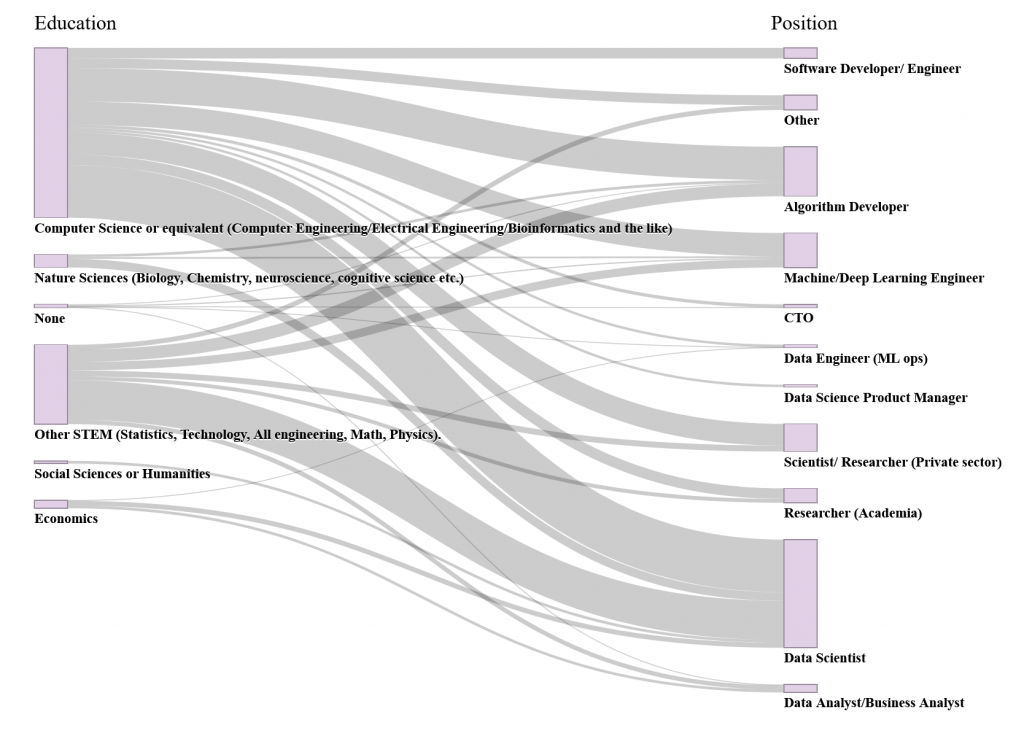
Data scientists come from a wide range of educational backgrounds. While the majority of them come from the discipline of computer science or other STEM fields, over 60% of economics, social science, and natural science graduates in our survey are data scientists. By contrast, 100% of software developers in our survey are computer science graduates. Scientists in the private sector all have educational backgrounds in computer science and other STEM fields.
We'll attempt to go deeper and consider education levels by separating undergraduates and graduates in the same discipline. The graph is more detailed and can help us to better understand the profile of each position (click on the picture to open the interactive graph on a different tab):

Summary
In conclusion, different positions can be classified as research-oriented vs engineering-oriented. A further categorization could be between data-positions and algorithmic-positions.
The ML engineer, researcher, and algorithm developer fall into the research-algorithmic category. The software developer falls into the engineering-algorithmic category. A data scientist belongs to the category of data-research, while a data analyst belongs to the category of data-engineering.
The differences between an algorithm developer, an ML engineer, and a researcher are, however, very minor. In some organizations, those titles and roles may be used interchangeably. Those interested in a specific position should review the job responsibilities graph to get a better sense of what that position entails.
The next post will look into the gender pay gap in the data industry.